
How to Create a DevRel KPI Dashboard That Actually Proves ROI
.png)
September 11, 2025

.svg)
6 minutes
.svg)
.svg)
What if your beautiful DevRel dashboard is the very thing sabotaging your team's future?
Most DevRel teams measure everything except what executives care about. They track Discord member counts, GitHub stars, and conference attendance while completely missing the metrics that determine budget renewals. It's like measuring the wrong side of a coin and wondering why leadership sees no value.
The brutal truth: traditional DevRel metrics create an illusion of progress while your program slowly becomes expendable. According to OpenView's Product Benchmarks research, most technology companies struggle to measure developer-focused go-to-market performance accurately, leading to misallocated resources and canceled programs.
Here's exactly how to build a DevRel KPI dashboard that connects developer engagement directly to business outcomes...and why most teams get this catastrophically wrong.
Key Insights: What Makes DevRel Dashboards Actually Useful
Business Impact Over Activity: Successful DevRel dashboards track behavior change and business outcomes, not participation theater. Your dashboard should answer "How is developer engagement driving our business forward?" not "How busy was our community this month?"
Leading vs. Lagging Indicators: The most predictive DevRel metrics happen weeks before revenue impact. Track developer activation milestones, community contribution quality, and advocate emergence patterns that predict future business growth.
Attribution Clarity: Developer evaluation journeys span months and multiple touchpoints. Effective dashboards implement multi-touch attribution models that credit DevRel activities for their actual influence on customer acquisition and expansion.
Executive Translation: Transform technical engagement metrics into business language executives understand. Instead of "answered 47 forum questions," report "reduced customer success workload by 23% through community-driven support."
Why Traditional DevRel Dashboards Fail Leadership Reviews
The moment your DevRel dashboard becomes a cost center instead of a growth engine is the moment you started measuring the wrong things.
We've worked with over 100 developer-focused companies, and the pattern is painfully consistent. Teams create beautiful dashboards filled with community growth curves and event attendance charts, then wonder why leadership questions the program's value during budget reviews.
The fundamental disconnect: traditional B2B marketing metrics assume linear sales funnels and predictable buyer journeys. Developer audiences follow completely different evaluation patterns that render standard marketing attribution useless.
Key Insight: Developers don't follow traditional sales funnels. They trial products, join communities, contribute feedback, and influence purchasing decisions through technical validation rather than sales conversations. Your dashboard must reflect this reality.
Supporting Evidence: According to Stack Overflow's 2024 Developer Survey, developers heavily rely on peer knowledge and community resources for tool discovery and evaluation, yet most DevRel dashboards track marketing engagement rather than technical influence.
Practical Application: Audit your current dashboard. If more than 50% of your metrics could apply to any marketing program, you're not measuring developer relations—you're measuring generic community activity.
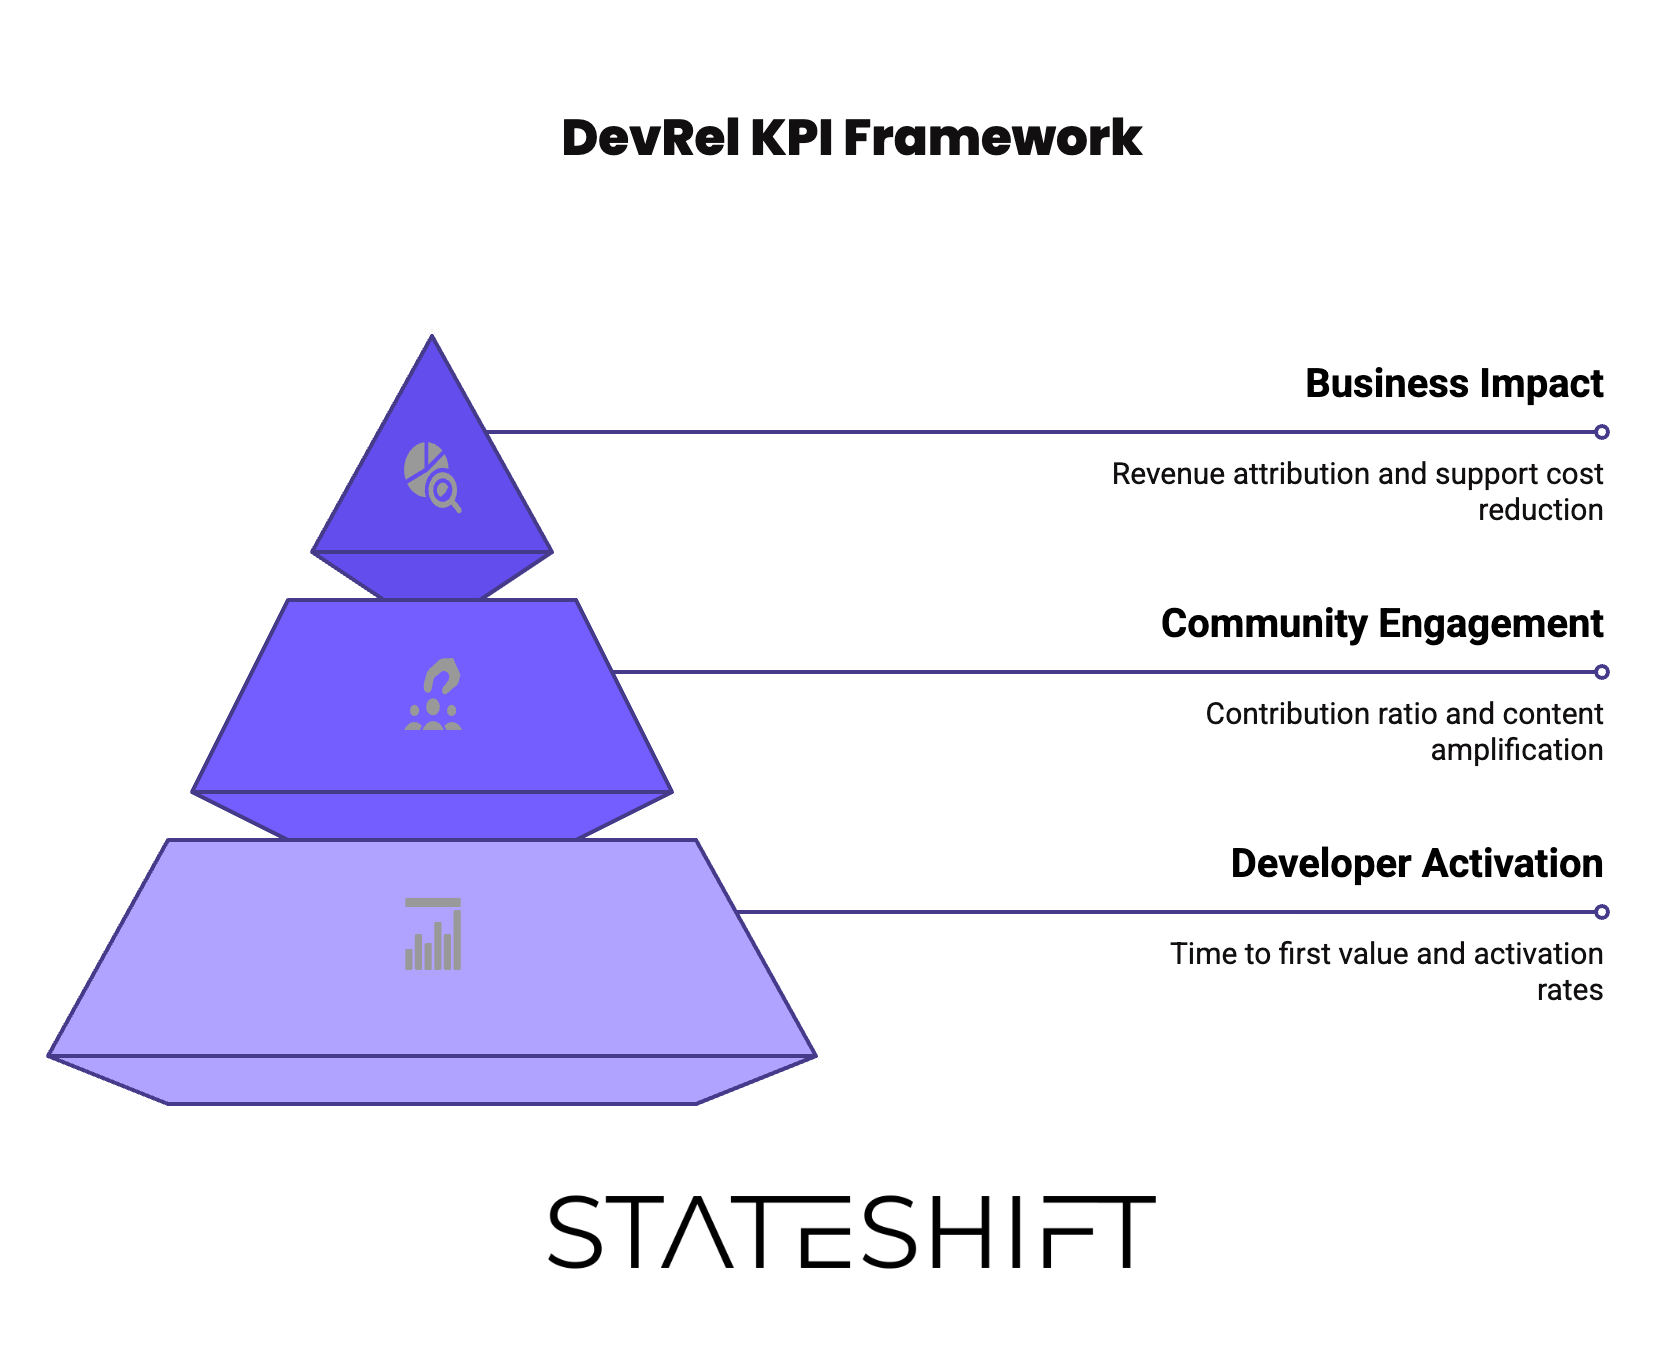
The Three-Layer DevRel KPI Framework
Effective DevRel measurement requires three distinct but connected layers that map developer engagement to business impact.
Layer 1: Developer Activation Metrics
Time to First Value (TTFV): The elapsed time from developer signup to achieving their first meaningful product milestone. Target under 15 minutes for simple tools, under 30 minutes for complex platforms.
Activation Completion Rate: Percentage of new developers who reach defined success milestones within their first week. Strong programs achieve 40-60% activation rates.
Technical Integration Depth: Track API calls made, features explored, and integration complexity achieved during trial periods. Developers who implement production integrations show 3x higher conversion rates.
In our work with a Series A API company, we discovered their dashboard tracked signups but missed the critical insight: developers who made successful API calls within 24 hours had an 87% higher lifetime value than those who took longer. Through our Blueprint Call process, we helped them redesign their measurement system around activation milestones rather than vanity metrics—and their board presentations finally showed clear DevRel ROI.
Layer 2: Community Engagement Quality
Contribution Ratio: Balance between value given and value received in community interactions. Healthy communities maintain 60-70% peer-to-peer support versus company-provided answers.
Content Amplification: Track how often community members share, reference, or build upon your technical content. This indicates trust and advocacy development.
Knowledge Asset Creation: Measure community-generated tutorials, code examples, and integration guides. These assets reduce support costs while accelerating new developer onboarding.
Advocate Pipeline Development: Identify developers progressing from consumers to contributors to advocates. Track this progression as a leading indicator of organic growth.
Leading developer community programs consistently see higher retention rates among developers who contribute documentation improvements early in their engagement, often becoming 3-4x more likely to recommend the platform to colleagues. This pattern appears across multiple successful developer platforms.
Layer 3: Business Impact Attribution
Revenue Attribution: Connect community engagement to customer acquisition and expansion revenue using multi-touch attribution models that account for extended developer evaluation cycles.
Support Cost Reduction: Calculate the monetary value of community-driven support versus company-provided customer success resources.
Feature Adoption Acceleration: Measure how community engagement correlates with faster adoption of new product capabilities and premium features.
Churn Prevention: Track how community-engaged customers show different retention patterns compared to product-only users.
Through our Blueprint Call process, we work with companies to identify which specific engagement activities correlate with measurable business outcomes, then help you design measurement approaches that tell a compelling story to leadership. This is exactly why our Acceleration Flywheel focuses on continuous measurement iteration—we help teams adapt their measurement strategies as both their communities and business models evolve.
Essential KPIs Every DevRel Dashboard Needs
Primary Business Metrics
Product Qualified Leads (PQLs): Developers who demonstrate meaningful product engagement through technical milestones. Track PQL-to-customer conversion rates, which typically range from 15-30% for developer tools.
Developer Retention Cohorts: Monthly cohorts showing how developer engagement evolves over time. Strong programs maintain 25-40% 6-month retention for activated developers.
Community-Driven Revenue: Revenue directly attributable to community engagement activities. Use multi-touch attribution to credit community interactions appropriately.
Support Deflection Value: Monetary value of community-driven support versus company-provided assistance. Calculate using average support ticket costs and resolution times.
Secondary Engagement Metrics
Technical Content Performance: Track documentation engagement depth, tutorial completion rates, and code example usage. These predict future product adoption.
Event Engagement Quality: Measure active participation in events rather than passive attendance. Track questions asked, follow-up contributions, and post-event implementation activity.
Advocacy Amplification: Monitor organic mentions, referral patterns, and unsolicited content creation. These indicate genuine developer enthusiasm versus manufactured engagement.
Leading Indicators
Contributor Pipeline Health: Track developers progressing through engagement stages from lurkers to contributors to advocates. This predicts future community growth.
Integration Complexity Growth: Monitor how developers advance from basic implementations to sophisticated integrations. This correlates with account expansion potential.
Cross-Product Engagement: For multi-product companies, track how community members explore additional offerings. This indicates platform adoption patterns.
Industry research consistently shows that companies tracking comprehensive developer engagement metrics achieve significantly more accurate ROI calculations compared to those using basic activity metrics.
Struggling to implement these measurement frameworks? This is exactly what Stateshift specializes in. We don't just give you theory—we work alongside your team to figure out which KPIs will show the biggest ROI and help you tell a compelling story about DevRel impact to executives. Our clients go from defending their budgets to getting program expansion requests. Book a Discovery Call to see how we can help you identify the metrics that will drive strategic investment.
Building Your DevRel Dashboard: Step-by-Step Implementation
Phase 1: Foundation Setup (Weeks 1-2)
Step 1: Establish baseline measurement for core business metrics. You can't optimize what you don't measure consistently.
Step 2: Implement product analytics tracking for developer behavior within your application. Use tools like Amplitude or Mixpanel for comprehensive user journey analysis.
Step 3: Set up community engagement tracking using platforms like Common Room to monitor cross-platform developer interactions, or consider custom analytics solutions for your specific needs.
Timeline Expectation: Basic tracking implementation typically requires 1-2 weeks with proper tool integration.
Phase 2: Attribution Implementation (Weeks 3-4)
Step 4: Design multi-touch attribution models that connect community engagement to business outcomes. This requires custom tracking beyond standard marketing automation.
Step 5: Implement cohort analysis to understand how developer engagement patterns correlate with long-term value creation.
Step 6: Create automated reporting workflows that translate technical metrics into business language for executive consumption.
This is exactly why we developed our Acceleration Flywheel approach. We work with teams to review their data, develop hypotheses about what metrics will show the biggest impact, and help you implement measurement strategies that tell a clear ROI story without overwhelming your technical teams.
Phase 3: Dashboard Optimization (Ongoing)
Step 7: Regularly review which metrics actually predict business outcomes versus those that simply track activity. Remove vanity metrics that don't drive decisions.
Step 8: Refine attribution models based on observed correlation patterns between community engagement and revenue generation.
Step 9: Expand measurement sophistication as your program scales and attribution patterns become clearer.
Through our Acceleration Calls, we help teams identify measurement gaps and optimization opportunities before they impact business results. We've seen companies transform their executive relationships by shifting from "Here's what we did" to "Here's how we drove revenue."
Common Dashboard Mistakes That Destroy DevRel Credibility
The Vanity Metrics Trap
Mistake: Tracking impressive-looking numbers that don't correlate with business value. GitHub stars, Discord members, and event RSVPs create an illusion of progress without substance.
Solution: Every metric on your dashboard should answer "How does this drive our business forward?" If you can't draw that connection, remove the metric.
Real Example: We've worked with multiple developer tools companies that had impressive community size metrics but couldn't connect those numbers to actual business outcomes. A common pattern we see is teams celebrating thousands of Discord or Slack members while struggling to show leadership how community engagement drives customer acquisition. When we help these teams implement business-focused measurement, they consistently discover that a small percentage of highly engaged contributors generate the majority of qualified leads and referrals.
The Attribution Black Hole
Mistake: Using traditional marketing attribution that misses the extended, technical evaluation process developers follow.
Solution: At Stateshift, we help teams identify which attribution models will actually capture developer evaluation cycles and show meaningful ROI. In our Discovery Calls, we work with you to map out the unique touchpoints in your developer journey and figure out which metrics will tell the clearest story of DevRel impact to your leadership. We've helped companies discover that 40-60% of their actual attribution was happening through channels their previous tracking completely missed.
The Activity Theater Dashboard
Mistake: Reporting on what your team did rather than what your audience accomplished. This creates busy-looking dashboards that executive leadership can't connect to business value.
Solution: Shift from "We hosted 5 events this month" to "Event attendees show 45% higher trial-to-paid conversion rates."
The biggest mistake we see companies make is building dashboards that justify their team's existence rather than demonstrating their impact on company growth. At Stateshift, we help teams flip this entirely—our clients go from defending their budgets to getting asked to expand their programs.
Tools and Technology for DevRel KPI Tracking
Essential Analytics Stack
Product Analytics: Amplitude for user behavior tracking, Heap for automatic event capture, or custom analytics solutions for specialized tracking needs.
Community Analytics: Common Room for multi-platform engagement tracking, or Discord Analytics for platform-specific insights.
Attribution Platforms: Segment for unified data collection, RudderStack for privacy-compliant tracking, or custom attribution solutions for sophisticated modeling.
Dashboard Creation: Tableau for comprehensive visualization, Grafana for real-time monitoring, or Metabase for accessible business intelligence.
Integration Requirements
Successful DevRel measurement requires data integration across multiple systems that traditional marketing stacks don't handle well. Your analytics infrastructure must connect:
- Product usage telemetry with community engagement patterns
- Support ticket resolution with community contribution activity
- Sales pipeline progression with developer advocacy signals
- Content engagement with actual product implementation success
This integration complexity is why many teams struggle with accurate DevRel measurement and why we focus heavily on helping you identify the right metrics during our Blueprint Call sessions. At Stateshift, we work with teams to figure out which attribution models will actually show ROI and help you tell the story of your DevRel impact to leadership.
Privacy and Compliance Considerations
Developer audiences demonstrate heightened privacy awareness and actively employ tracking prevention tools. Your measurement approach must balance comprehensive attribution with privacy-conscious implementation:
Consent-based tracking: Transparent data collection with clear value exchangeFirst-party data emphasis: Authentication-based tracking rather than anonymous cookiesProgressive profiling: Gradual data collection through natural product interactions
Presenting DevRel ROI to Executive Leadership
Executive Communication Framework
Lead with Business Impact: Open executive reports with revenue attribution, cost reduction, and customer acquisition metrics before diving into engagement details.
Context Before Numbers: Explain why developer evaluation patterns differ from traditional B2B buyers, setting appropriate expectations for attribution complexity.
Trend Analysis: Show progress over time rather than snapshot metrics. Executives care about improvement trajectories, not single-point measurements.
Competitive Context: Position DevRel performance relative to industry benchmarks and competitive intelligence when available.
Sample Executive Dashboard Structure
Top Section: Revenue impact, customer acquisition attribution, and support cost reduction
Middle Section: Leading indicators like community health trends and developer activation improvements
Bottom Section: Operational metrics like content performance and event effectiveness
The most successful executive presentations we've helped clients create focus 70% on business impact and 30% on community health indicators. Through our coaching process, we help teams figure out how to translate technical metrics into executive language that tells a compelling story about DevRel impact and drives budget approvals rather than questioning.
Quarterly Business Review Format
Quarter Overview: Primary business outcomes achieved through DevRel activities
Attribution Analysis: How community engagement contributed to customer acquisition and expansion
Investment ROI: Cost per acquired customer through DevRel versus other channels
Forward-Looking Metrics: Leading indicators that predict next quarter's business impact
Through our work with venture-backed companies, we've learned that executives respond best to DevRel measurement that mirrors the format they use for evaluating other growth investments.
FAQ: Building Effective DevRel KPI Dashboards
What are the most important metrics for a DevRel KPI dashboard?
Track three core areas: developer activation metrics (time to first value, integration success), community engagement quality (contribution ratios, advocate development), and business impact attribution (revenue correlation, support cost reduction). Avoid vanity metrics like total members or event attendance that don't correlate with business outcomes. Focus on metrics that predict future business growth rather than just measuring past activity.
How do I prove DevRel ROI when developer journeys are so complex?
Use multi-touch attribution models designed for extended evaluation cycles rather than traditional marketing funnels. Track correlations between community engagement and business outcomes over 6-12 month periods. Implement cohort analysis showing how community-engaged developers differ from product-only users in retention and expansion patterns. Survey customers about discovery and evaluation influences to capture attribution that traditional tracking misses.
What tools should I use to track DevRel KPIs effectively?
Essential stack includes product analytics (Amplitude, Mixpanel), community engagement tracking (Common Room), and unified data platforms (Segment, RudderStack). Avoid over-tooling early; start with basic tracking and expand sophistication as your attribution models improve. Many effective dashboards use simple spreadsheet analysis for correlating engagement with business outcomes before investing in complex automation.
How often should I update my DevRel KPI dashboard?
Update leading indicators (community health, developer activation) weekly for operational optimization. Review business impact metrics (revenue attribution, customer acquisition) monthly to identify trends without getting lost in noise. Conduct quarterly comprehensive analysis to refine attribution models and measurement approaches. Avoid daily reporting that creates measurement theater without actionable insights.
How do I handle attribution when developers influence purchases but don't make final decisions?
Track influence patterns rather than direct conversion attribution. Monitor how developer engagement correlates with account progression through sales stages. Survey customers about technical evaluation influences and community interactions during buying decisions. Focus on leading indicators like technical champion development and internal advocacy that predict eventual purchases even when developers aren't final decision-makers.
What's the biggest mistake teams make when building DevRel dashboards?
Measuring activity instead of outcomes. Teams track what they do (events hosted, content published) rather than what their audience accomplishes (problems solved, integrations completed). This creates impressive-looking dashboards that executive leadership can't connect to business value. Always prioritize metrics that answer "How is this driving our business forward?" over metrics that justify team activity.
Future-Proofing Your DevRel Measurement Strategy
Emerging Trends in Developer Relations Analytics
AI-Assisted Attribution: Machine learning tools are beginning to identify previously invisible correlation patterns between community engagement and business outcomes. These systems analyze behavior sequences that human analysts typically miss.
Predictive Community Health Models: Advanced analytics now predict community health issues before they impact business metrics, enabling proactive intervention strategies rather than reactive damage control.
Cross-Platform Integration Tracking: As developer tool ecosystems become more interconnected, measurement systems are evolving to track advocacy and adoption across partner platforms and marketplace distributions.
Adapting Measurement for Market Evolution
Privacy-First Analytics: Prepare for cookie deprecation and increased privacy regulation by building first-party data collection strategies that maintain attribution accuracy while respecting developer privacy preferences.
Community-Led Growth Models: Traditional customer acquisition costs are rising while community-driven growth shows increasing effectiveness. Adjust your measurement framework to capture this shift in growth economics.
Technical Influence Quantification: New methodologies are emerging for quantifying technical influence and peer recommendation patterns that drive developer tool adoption but remain invisible to traditional attribution.
This is exactly why our Acceleration Flywheel approach focuses on continuous measurement iteration rather than static dashboard implementation. The most successful DevRel programs adapt their measurement sophistication as both their communities and the broader market evolve.
Key Takeaways: Building DevRel Dashboards That Drive Growth
Measure Business Impact Over Activity: Your dashboard should demonstrate how developer engagement drives customer acquisition, retention, and expansion rather than just tracking community activity levels.
Implement Multi-Touch Attribution: Developer evaluation cycles span months and multiple touchpoints. Use attribution models that credit community interactions appropriately rather than defaulting to last-touch marketing attribution.
Focus on Leading Indicators: Track developer activation patterns, community contribution quality, and advocate development that predict future business growth rather than just measuring historical engagement.
Executive Communication Strategy: Present DevRel metrics in business language that leadership understands, emphasizing revenue correlation, cost reduction, and competitive advantage rather than community-specific terminology.
Continuous Optimization: Regularly refine your measurement approach based on observed correlation patterns between community engagement and business outcomes. Avoid static dashboards that become disconnected from actual program impact.
The companies that master DevRel measurement don't just prove their value—they become indispensable growth engines that executives actively invest in and expand.
Ready to Build a DevRel Dashboard That Actually Proves ROI?
Most teams spend months building dashboards that still don't prove DevRel value to leadership. At Stateshift, we've helped over 100 developer-focused companies figure out which metrics actually matter and how to tell a compelling impact story to executives—and we can do the same for you.
Here's exactly how we help:
Discovery Calls: We work with you to identify your biggest measurement gaps and figure out which specific metrics your leadership actually cares about. No generic advice—we dig into your business model, revenue goals, and executive priorities to find the metrics that will show clear ROI.
Blueprint Sessions: Our 90-minute workshops help you design measurement strategies that prove DevRel value from day one. We work with you to map your developer journey to business outcomes and identify which attribution approaches will tell the clearest impact story.
Ongoing Acceleration: Through regular coaching calls, we help you refine your measurement approach and continuously improve how you tell your DevRel impact story. We don't just deliver strategy documents and disappear—we coach you through implementation.
The Stateshift Difference: We work alongside your team as coaching partners, not consultants who dump reports and leave. Our Acceleration Flywheel helps you continuously identify which metrics show the biggest impact and how to communicate that value to leadership.
Stop defending your DevRel budget with activity reports. Book a Discovery Call and learn how to identify the KPIs that will drive program expansion and strategic investment.
Related Posts
.svg)


.png)

%20(1).png)
%20(1).png)

%20-%20Community%20metrics%20thumbnail.png)


%20(1).png)


.svg)
.svg)
.svg)