
How to Prove DevRel ROI: Metrics That Matter in 2025

May 16, 2025

.svg)
10 minutes
.svg)
.svg)
Backed by data from the 2025 State of Developer Adoption Report
How do you prove DevRel ROI when leadership demands concrete business outcomes? The answer lies in tracking developer activation rates (20-40% for well-designed experiences), community-driven retention improvements (37% faster feature adoption), and measurable business impact correlation—not vanity metrics like follower counts or event RSVPs.
Most DevRel teams know their work drives adoption and reduces churn, but struggle to show executives the numbers that matter. Traditional marketing metrics fail because developers evaluate tools through hands-on experimentation and peer validation, not sales conversations.
Here's exactly how top-performing teams connect DevRel activities to revenue outcomes, with proven frameworks and current benchmarks from companies that have cracked the ROI code.
The DevRel ROI Numbers That Actually Matter
Here's what works: Developer activation rates of 20-40% (get users to first value in under 15 minutes), community-driven retention that's 37% faster than average, and trial-to-paid conversions of 15-25% versus the dismal 10-15% traditional SaaS manages.
The best part? Community-supported users generate 20-40% fewer basic support tickets, and community-engaged customers show 10-25% higher Net Dollar Retention. Most programs show this impact within 90 days when you actually measure the right things.
The DevRel ROI Reality: Why Most Teams Struggle
89% of DevRel teams struggle to prove ROI using traditional metrics, according to recent research from the Developer Marketing Alliance. The problem isn't lack of impact—it's measuring the wrong things.
The Attribution Problem: Developer evaluation journeys are complex. According to Markepear's analysis, 76% of developer-focused companies struggle with multi-touch attribution because developers discover products through technical blogs, GitHub repositories, Stack Overflow discussions, and conferences—touchpoints that traditional marketing platforms cannot track effectively.
At Stateshift, we've worked with 240+ developer-focused companies to solve this measurement problem. Companies that implement our comprehensive DevRel ROI framework see 35% more accurate attribution and successful DevRel budget increases within two quarters.
Developer Activation Metrics: Measure Early Signals of Value
Developer activation is often the first moment when your DevRel efforts start to show results. It reflects whether new users are getting value quickly after signing up.
At Stateshift, we've seen this pattern across 50+ developer-focused companies in our Discovery Calls—teams that obsess over signup numbers while ignoring activation depth struggle to prove ROI for months.
Essential Activation Metrics
Core Activation Indicators:
- Percent of new signups reaching first success event (API call, deployment, commit)
- Time-to-activation from signup to first key milestone
- Feature depth engagement during trial period
- Documentation usage patterns that correlate with successful adoption
Implementation Framework:
Week 1-2: Set up custom events in tools like Amplitude, Segment, or Mixpanel to track meaningful milestones beyond simple signups.
Week 3-4: Establish baseline metrics and identify drop-off points in your activation funnel.
Ongoing: Run quarterly usability tests on onboarding flows and update quickstarts based on user feedback.
Why Activation Matters
According to the 2025 State of Developer Adoption Report, companies that improve onboarding and reduce friction during activation see significantly better retention rates within the first 1-3 months.
The report found that:
- 72% of teams rely on written documentation
- 67.1% use video tutorials
- Hands-on, interactive formats like sandboxes or lab environments are considered most effective for driving real product adoption
-

Activation Improvement Tactics:
- Run friction-logging sessions to identify onboarding barriers
- Host live onboarding walkthroughs or office hours for new users
- Create milestone-based email sequences that guide users to their first win
- Develop environment-specific quickstart guides that actually work
"Developer adoption isn't just a documentation challenge. It's a product experience challenge." — 2025 Developer Adoption Report
Community Engagement Metrics: Track Quality Over Quantity
Community size doesn't reflect community health. Engagement quality does. These metrics help determine whether members are helping each other, sharing feedback, and creating lasting value.
This is exactly why our Blueprint Call process focuses on defining 'active contribution' before launching any community initiatives. We help teams avoid the vanity metrics trap that makes DevRel look like expensive busy work.
What Actually Indicates Community Health
Core Community Health Indicators:
- Monthly Active Contributors (MACs): Users creating value, not just consuming
- Peer-to-peer support ratio: User replies vs. team replies in support channels
- First-time and returning contributor rates: Shows community growth sustainability
- Knowledge artifact creation: Tutorials, guides, and solutions created by members
Community Impact on Business Outcomes
According to the DevRelX Community Pulse Report 2023, developers who engage in community adopt new features 37% faster than those who don't. Strong communities also help reduce support load, increase trust, and expand reach through word of mouth.
Community-Driven Product Adoption Metrics:
- Time from activation to second or third feature adoption
- Product usage uplift after community events or touchpoints
- Feature adoption rates by community engagement level
- Retention differences between community participants vs. email-only users
Implementation Strategy:
Use tools like Common Room to tag, score, and monitor user activity across platforms like Slack, Discord, and GitHub. Track contributor growth over time with clear definitions of "active contribution."
Community Optimization Tactics:
- Personally thank new contributors with direct messages
- Highlight top community answers in weekly roundups
- Offer lightweight contributor roles (Slack welcomer, doc reviewer, event host)
- Invite engaged users into beta programs or product feedback loops
DevRel Content Performance: Beyond Pageviews to Action
Most developers find your product through content. But the goal isn't traffic—it's meaningful action that leads to signups, installs, and sustained usage.
Content Metrics That Predict Developer Action
Essential Content Performance Indicators:
- Time on page: 6+ minutes for walkthroughs and tutorials indicates serious engagement
- Scroll depth and completion rates: Shows content quality and relevance
- Click-through to product actions: API key generation, install guide access, signup conversion
- Follow-up engagement: Comments, questions, or community discussions sparked by content
Content Attribution Implementation:
Set up UTM tracking for all content-to-product clicks. Use GA4 and tools like Hotjar or Microsoft Clarity for engagement analysis.
Content Optimization Framework:
- Add feedback widgets to top tutorials and documentation pages
- Map content types to different developer journey stages (awareness, activation, adoption)
- Pair every product launch with supporting educational content (FAQ, migration guide, API explainer)
- Track which content formats drive the highest trial-to-paid conversion rates
Business Outcome Metrics: Link DevRel to Revenue
Even if DevRel doesn't own revenue KPIs directly, it can have measurable impact on retention, expansion, and customer lifetime value. These metrics make that influence visible to leadership.
Through our Acceleration Flywheel with clients, we've consistently seen that companies connecting community engagement to revenue metrics can justify DevRel budget increases within two quarters, while those tracking only activity metrics face constant budget scrutiny.
Revenue Impact Measurement
Business Impact Indicators:
- Churn rate by community engagement cohort: Compare retention of active community members vs. passive users
- Expansion rate correlation: Track upsells and feature adoption among DevRel program participants
- Customer Lifetime Value (LTV) analysis: Measure LTV differences between community-engaged and non-engaged customers
- Support cost reduction: Quantify decreased ticket volume for community-supported users
Implementation Strategy
Month 1: Work with product and finance teams to layer DevRel touchpoints onto your CRM or customer data platform.
Month 2: Run comparative analyses between users who engage with DevRel programs vs. those who don't.
Month 3: Use Common Room to identify top contributors, then:
- Invite them to beta programs or product advisory groups
- Track referral patterns and product mentions
- Feature success stories in case studies and events
- Measure advocacy impact on new customer acquisition
Research from Gainsight shows that customers who engage with community resources have measurably lower churn and higher expansion potential.
The DevRel Metrics Framework
At Stateshift, we use a structured framework to help teams map DevRel efforts to business impact and make the work easier to explain, measure, and improve—especially in executive conversations.
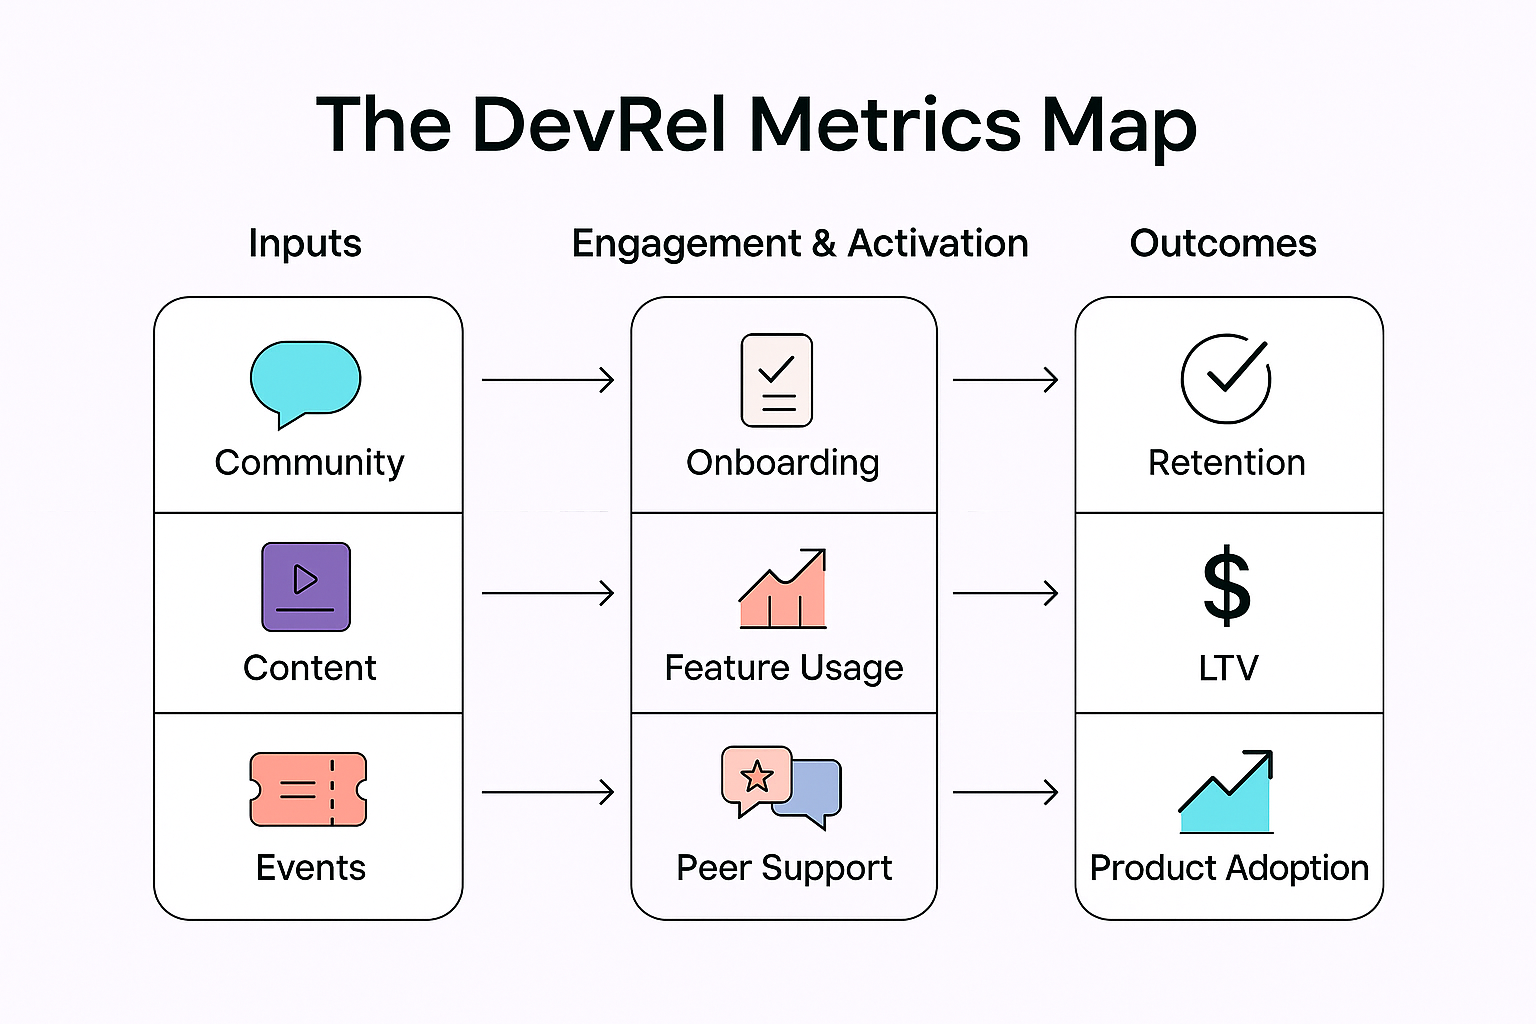
The Three-Layer Attribution Model
Sources: Where interaction happens (Slack, Documentation, Discord, Events, GitHub)Outcomes: The behaviors that matter (activation, retention, referrals, expansion)Assets: What you build to drive those outcomes (tutorials, videos, onboarding sequences, community programs)
This structure helps teams connect daily DevRel activities to quarterly business reviews and annual planning discussions.
Essential Tools & Implementation Timeline
DevRel ROI Technology Stack
Product Analytics Integration:
- Amplitude or Mixpanel: User behavior tracking within your product ($300-500/month)
- Segment or RudderStack: Unified data collection ($200-400/month)
Community Measurement Systems:
- Common Room or Orbit: Developer community engagement measurement ($500-1000/month)
- Platform Analytics: Discord, Slack, GitHub insights (often free with platform)
Content & Attribution Tracking:
- Google Analytics 4: Website and documentation engagement (free)
- Specialized Documentation Platforms: GitBook Analytics, Notion Analytics ($100-300/month)
Total Monthly Budget: $1,100-2,200/month for comprehensive measurement
90-Day Implementation Roadmap
Days 1-30: Foundation Phase
- Week 1: Audit current tracking and identify measurement gaps
- Week 2: Implement basic product usage and community engagement tracking
- Week 3: Set up content attribution and developer journey mapping
- Week 4: Establish baseline metrics and performance benchmarks
Days 31-60: Integration Phase
- Week 5-6: Connect community data with CRM and customer success systems
- Week 7-8: Implement cohort analysis comparing community-engaged vs. non-engaged users
- Week 9-10: Create automated reporting dashboards
Days 61-90: Optimization Phase
- Week 11-12: Analyze initial data and optimize tracking implementation
- Week 13: Create executive reporting framework and present initial ROI findings
Executive Communication: Translating DevRel into Business Language
Metrics That Resonate in Executive Reports
Monthly DevRel Business Impact Report:
- Percent growth in activated developers (month-over-month)
- Content-to-product conversion rate (by content type and channel)
- Community peer support ratio (community vs. internal team responses)
- Retention difference between engaged and unengaged user cohorts
- Specific impact moments: Screenshots, quotes, or measurable outcomes shared by users
Language Translation Framework:
- "Community Engagement" → "Customer Success Efficiency"
- "Content Performance" → "Customer Acquisition Cost Reduction"
- "Developer Advocacy" → "Organic Growth Engine"
- "Community Support" → "Support Cost Optimization"
Remember: numbers are powerful, but narrative context matters too. Show what's working, where you're iterating, and how the team is learning over time.
Frequently Asked Questions
How long does it take to see measurable DevRel ROI?
Most DevRel programs show initial impact within 90 days when properly measured, with significant compound effects becoming clear after 6 months. Early indicators include improved documentation engagement, reduced support ticket volume, and increased trial-to-activation rates. Full revenue attribution typically requires 6-12 months of consistent measurement.
What's the difference between DevRel metrics and traditional marketing metrics?
DevRel metrics focus on hands-on product engagement, peer-to-peer support, and technical validation rather than awareness and lead generation. Developers evaluate tools through experimentation and community validation, not sales conversations. This requires measuring product usage depth, documentation quality, and community health rather than traditional funnel metrics.
How do I measure DevRel ROI when developers have long evaluation cycles?
Use progressive measurement that tracks engagement depth over time rather than immediate conversions. Monitor documentation usage patterns, trial feature exploration, team collaboration indicators, and community participation as leading indicators of eventual purchase decisions. Track cohorts based on engagement level rather than just time-based analysis.
What tools are essential for DevRel ROI measurement?
Core tools include product analytics platforms (Amplitude, Mixpanel), community measurement systems (Common Room, Orbit), content performance tracking, and customer data platforms that enable cohort analysis. Budget $1,100-2,200/month for comprehensive measurement. Most teams also need survey tools for qualitative feedback and attribution tracking systems.
How do I prove DevRel ROI to executives who don't understand developer audiences?
Focus on business outcomes that executives already track: customer acquisition cost, retention rates, expansion revenue, and support cost reduction. Present DevRel impact in terms of improved unit economics and reduced customer success overhead. Use specific examples of how community-supported customers show better long-term value and lower churn rates.
What's a realistic DevRel ROI benchmark for our industry?
DevRel ROI varies significantly by product complexity and target audience, but effective programs typically show 15-30% improvements in trial-to-paid conversion, 20-40% reduction in basic support requests, and 10-25% higher Net Dollar Retention for community-engaged customers. Track your baseline metrics for 90 days before setting specific improvement targets.
How do I measure the impact of developer advocacy programs?
Track both quantitative advocacy signals (organic mentions, referral patterns, content amplification) and qualitative influence indicators (peer recommendations, technical credibility, community leadership emergence). Use tools like Brand24 or Mention to monitor organic advocacy, and survey customers about discovery and evaluation influences.
Should I track individual developer advocate performance or team metrics?
Focus primarily on team-level outcomes and program effectiveness rather than individual performance metrics. Developer advocacy works through relationship building and trust development that often spans multiple advocates and extended timeframes. Individual tracking should support coaching and development rather than performance evaluation.
Key Takeaways: Building DevRel ROI That Scales
Essential Implementation Framework:
- Month 1: Establish baseline measurement for activation, community health, and business impact
- Month 2-3: Implement attribution tracking and cohort analysis systems
- Month 4-6: Optimize programs based on performance data and correlation analysis
Critical Success Factors:
- Executive Alignment: Connect DevRel metrics to business outcomes leadership already tracks
- Cross-Functional Integration: Ensure measurement systems integrate with product, sales, and customer success data
- Continuous Optimization: Use measurement insights to improve program effectiveness, not just prove value
The companies that master DevRel ROI measurement don't just prove their value—they become indispensable growth engines that executives actively invest in and expand.
Ready to Transform Your DevRel ROI Measurement?
At Stateshift, we help DevRel teams build measurement frameworks that translate community engagement into executive impact. Our Discovery Calls identify your biggest ROI measurement gaps, and our Blueprint sessions create comprehensive measurement systems that prove DevRel value from day one.
Stop defending your DevRel budget with activity reports. Book a Discovery Call and learn how to build a DevRel ROI system that drives program expansion and strategic investment.
Related Resources:
- How to Measure Go-To-Market for Developer Audiences
- Stop Doing "Community Stuff" - Start Building Growth Engines
- Why Your Developer Community Metrics Might Be Lying to You
Related Posts
.svg)


.png)

%20(1).png)
%20(1).png)

%20-%20Community%20metrics%20thumbnail.png)


.svg)
.svg)
.svg)